One of my students' favorite math units is graphing! These graphing activities for 2nd graders are a hit year after year because it's engaging and fun! They get excited creating their own questions, polling their friends, and finding out who “wins” – you know the option with the most points. They get so engrossed in the learning that they don't even realize they're doing math!
Let's take a peak…
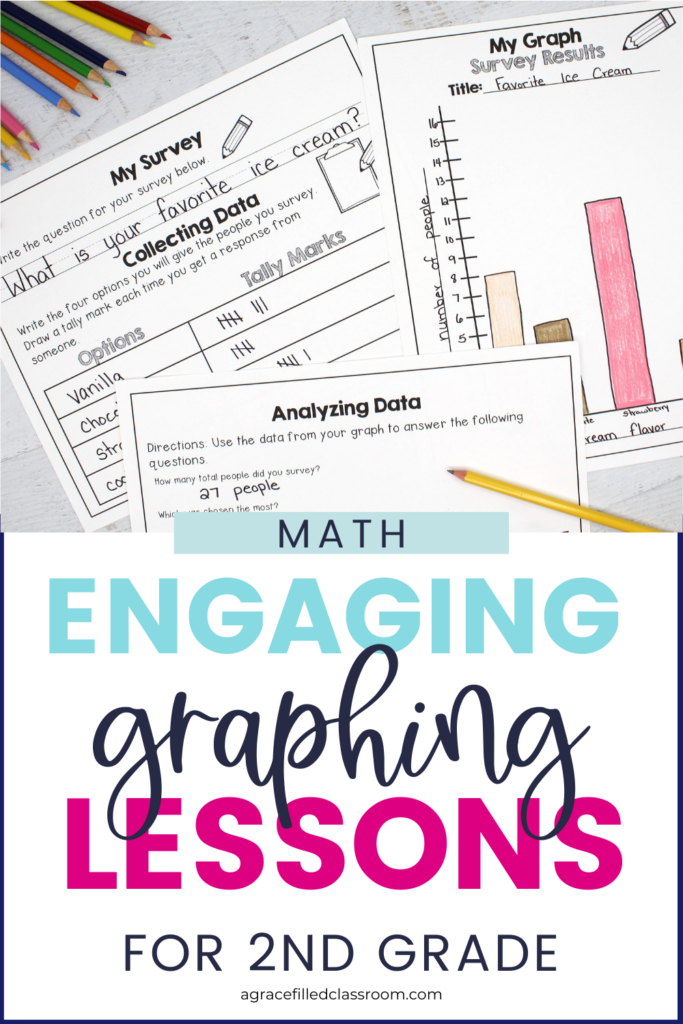
Graphing is an important standard in second grade and by using this fun resource, we have found a way to make it engaging and educational. The materials provided will be enough for about 3-5 days of graphing lessons!
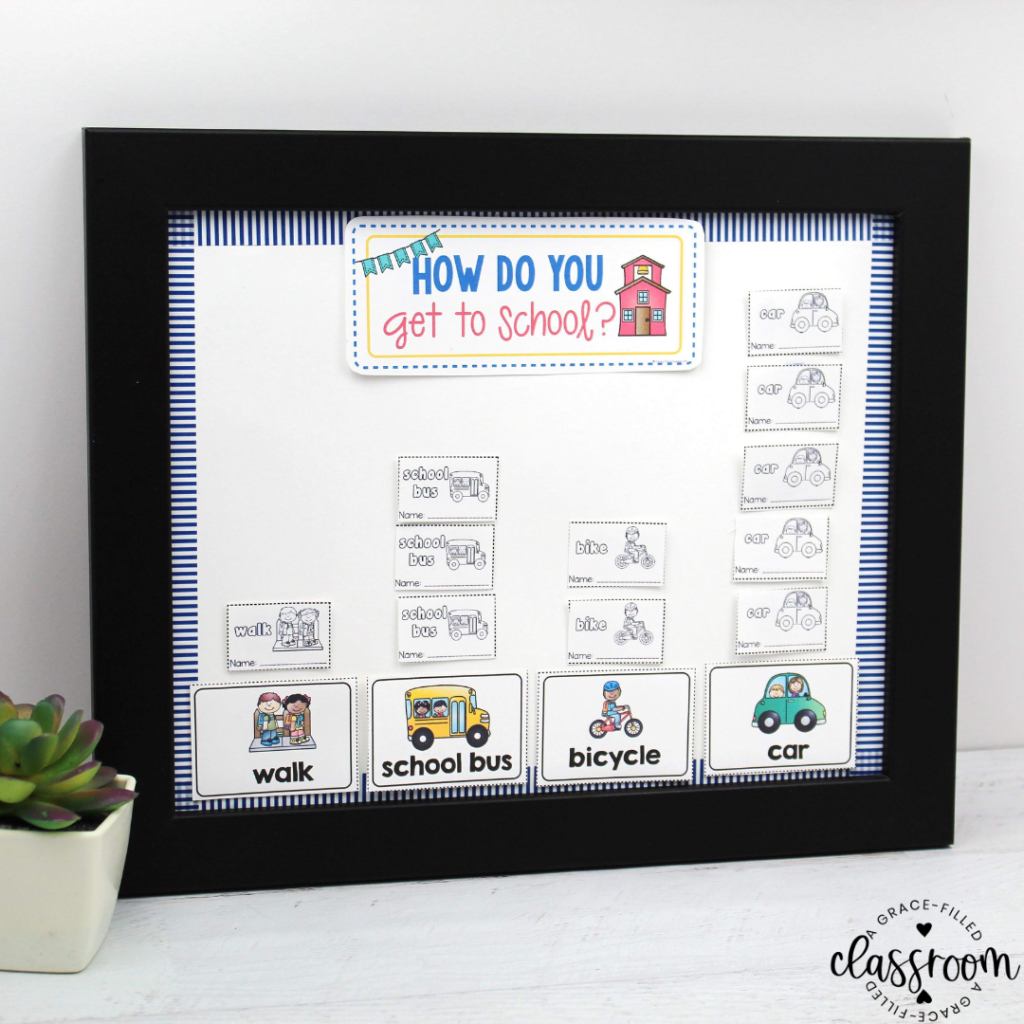
In my classroom, I start by teaching about the different kinds of graphs we'll be using in second grade; bar graphs and picture graphs. I start by piquing students' interests by creating a whole-class graph about how we get to school.
The resource is scaffolded so that you can model and then slowly go from “we do” to “you do” in the classroom.
Next, we practice with pre-set data. Work together on a graph or two as a class to help students understand the steps. With six practice graphs, there is plenty of practice provided to get skilled at tallying data, drawing a graph, and analyzing the data. Students are asked common questions such as:
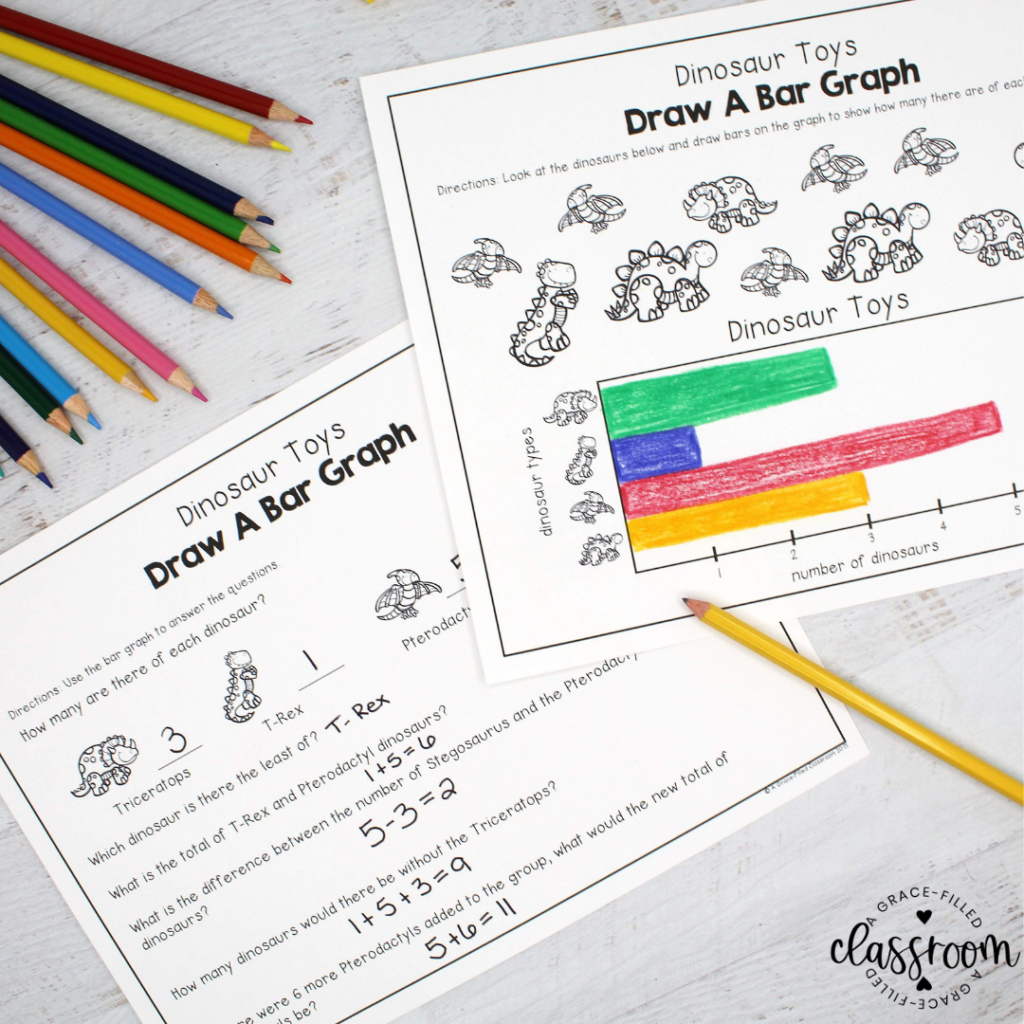
We talk about how to make sure your graph is valid and what that means, and making sure the graph represents the data that was collected.
Finally, students put their knowledge to work by conducting their own survey!
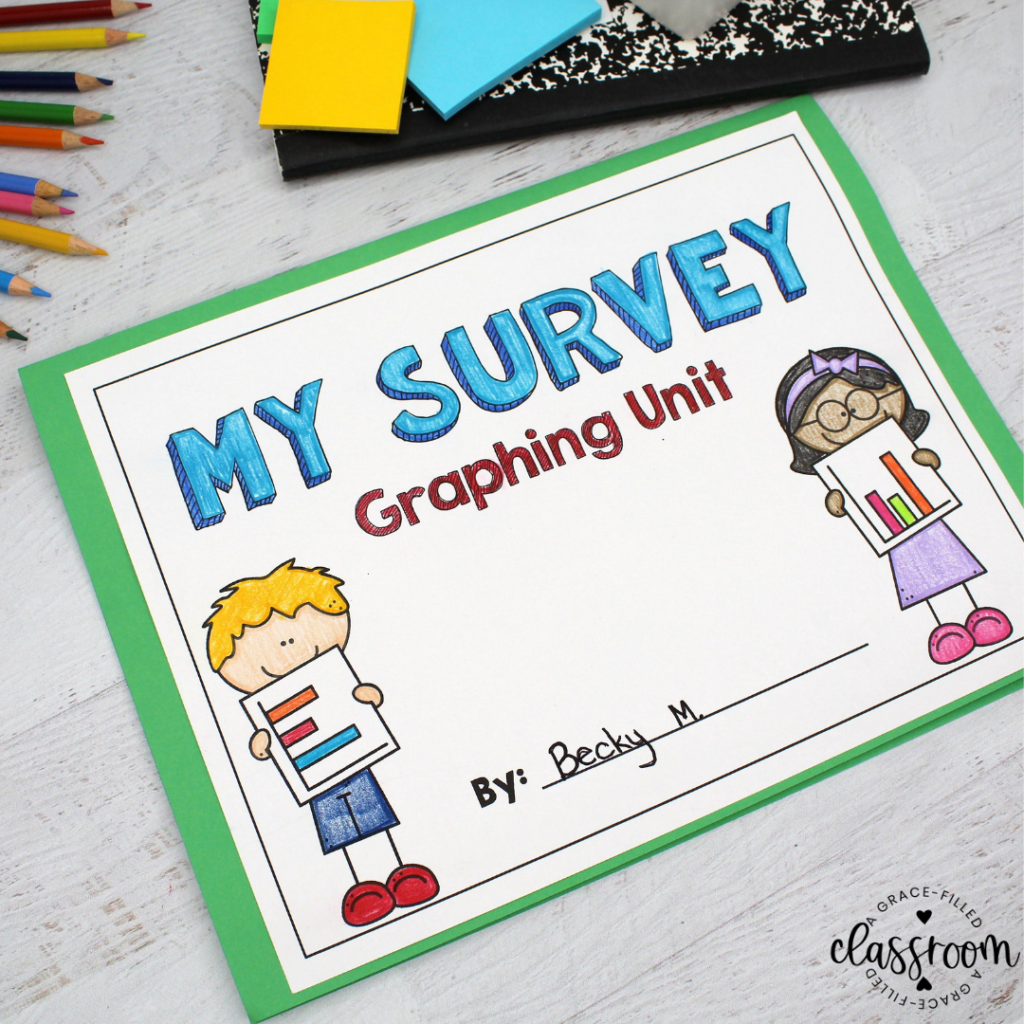
Have students come up with their own question and 4 answer choices, and then they can go around the room asking their fellow students their opinion. They'll get to practice conducting surveys, collecting data, and creating graphs to represent the data!
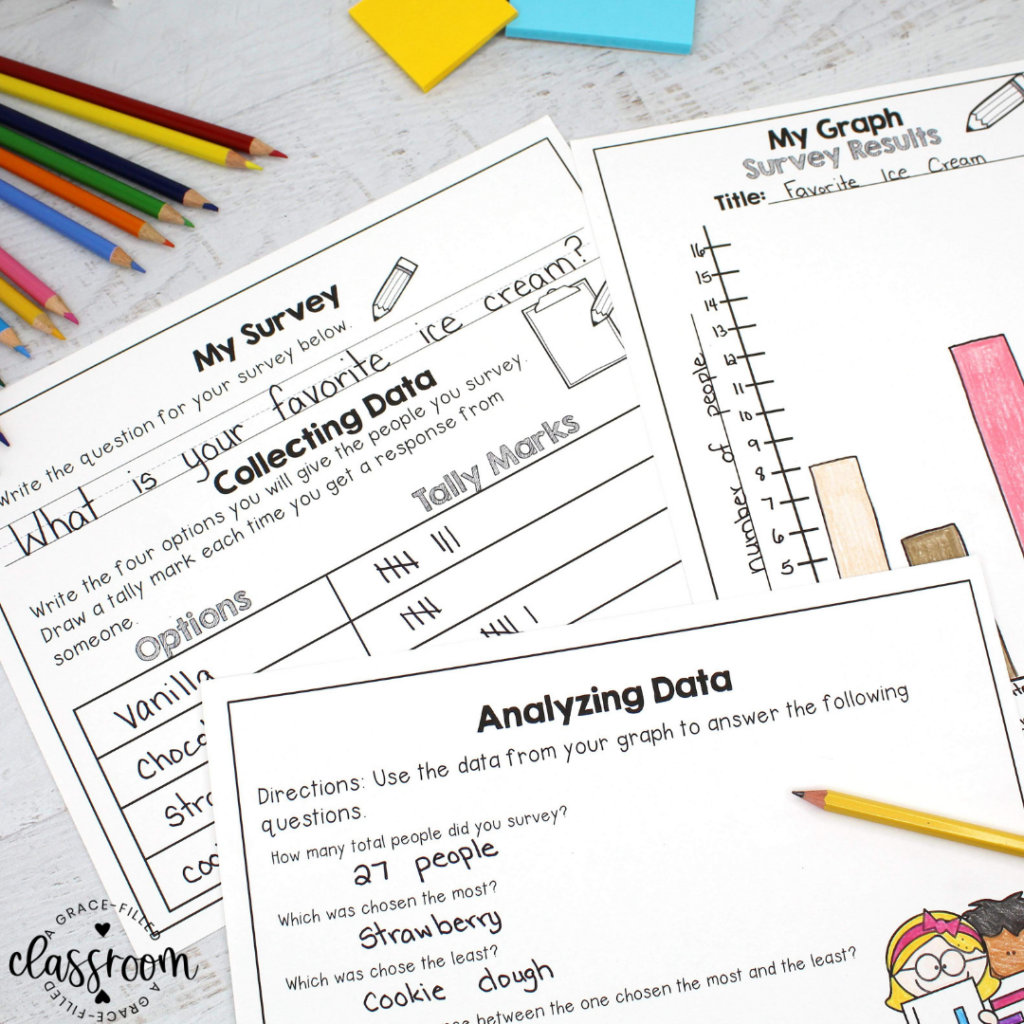
Want to try out this resource for yourself? Take a look at the tips and tricks that I can give you coming from a teacher who has done it in their classroom.
2nd graders are often pretty indecisive. They will come up with a lot of possibilities to answer their question and that could leave your data all over the place. Give students the answer choices so they have options that they don’t have to waste time thinking about. When students are filling out graphs, make sure they have pre-determined answers.
One thing we always talk about as a class is to make sure our data is accurate. We made sure the number of students in the classroom matched the number of students surveyed with a checklist of names and crossing them off once they have been asked. This makes sure that the numbers are accurate.
When using these graphing activities for 2nd graders make sure to allow them to pick survey questions that interest them. Right now, Among Us and TikTok are popular, so I would include those types of things in my survey. You want to make sure the students are interested and/or excited about the information they are learning about. When students are connected, they are more engaged.
Graphing and data can be one of the most fun units you can teach. With this awesome graphing activities for 2nd graders resource, you can make sure that not only your students grow academically, but they have a lot of fun doing it.
 Teaching in a primary classroom can be overwhelming! Have you ever wondered… How can I meet all the demands of teaching and still make sure I am teaching my students to be good world citizens? How can …
 A Grace-Filled Classroom is a participant in the Amazon Services LLC Associates Program, an affiliate advertising program designed to provide a means for sites to earn advertising fees by advertising and linking to Amazon.com.
Copyright © 2024 A GRACE-FILLED CLASSROOM | Terms and Conditions